

Economic and Market Update
Coming into 2024, questions remained whether the U.S. economy could continue to skirt a recession. Expectations were that the Fed would have to cut interest rates as the economy would slow and labor markets would deteriorate.
Instead, after GDP growth slowed to 1.6% in Q1 2024, the U.S. economy reaccelerated to 3% in Q2, followed by 3.1% in Q3. Expectations are that growth did slow some in Q4, but a recession is nowhere in sight and the numbers are consistent with the U.S. economy continuing along the path towards a soft-landing.[1]
In addition, we ended the year with labor markets generally intact as the economy added 180,000 jobs on average through November and the unemployment rate failed to fall off a cliff, nudging higher to 4.2% through November (December data will be available on Friday. The ADP Labor report indicates continuing job gains). Layoffs indicative of a deterioration in labor markets have not materialized as new unemployment filings have trended mostly sideways in the low 200,000’s, basically in line with conditions in 2018 and 2019 ahead of the pandemic.[2]
Furthermore, the economy made more progress on inflation. While arguably slower than the Fed would have liked, annual CPI moved from 3.4% in December 2023 to 2.7% in November, while core CPI (CPI ex Food and Energy) moved from 3.9% to 3.3%. PCE, the Fed’s preferred inflation gauge, moved from 2.7% in December 2023 to 2.4% in November.[3]
At some point, economists may have to consider whether the economy has already attained an elusive soft-landing and whatever comes next is a new event.
While the economic numbers generally were good, the strength of the economy and stickiness in inflation slowed the Fed’s pace of rate cuts. (See Dec 2024 Eye on the Fed). Stronger than expected data also had bond markets thinking a higher real yield is warranted as longer-term interest rates reversed higher starting in December. The 10-year Treasury yield initially declined as expectations built that the Fed would have to cut rates, and the Fed did, in fact, start to cut with a 0.5% move in September. The key 10-year rate bottomed out at 3.6% in mid-September concurrent with the first rate cut. However, as data firmed, rates started to move back up and the 10-year ended 2024 at 4.58%, slightly lower than the April high, but higher than the 3.88% ending value in 2023.[4]
Equity markets generally rallied on lower interest rates and, late in the year, a year-end Trump bump which partially fizzled out in December.
The S&P 500 ended the year up 25.02%[5], the second year in a row of 20%+ gains. The headline number masks the performance of the average stock in the cap weighted S&P 500 as the Magnificent 7 group of stocks returned 66.9%, led by Nvidia with a 171% return. On an equal weighted basis, the S&P 500 return was closer to 10.9%, showing that the average stock did not get close to the returns of the Mag 7. Small cap returns were in line with large caps excluding the Mag-7 with a 10% return.[6]
Through Q3, international stock performance was in line with U.S. counterparts with the MSCI EAFE index (developed international markets) up nearly 12%. Following the Fed’s rate cut and subsequent Trump election, international developed market performance diverged from U.S. stocks, losing 8.11% over Q4 to end the year at a disappointing 3.82%.[7] Much of this was driven by U.S. dollar strength with the dollar climbing 8% for Q4 and 7% for 2024 overall. Emerging market stocks were further ahead than developed markets, but suffered the same dollar induced fate in Q4 to end the year at a 7.5% return.
Putting equity performance together, any portfolio that underweighted the Mag-7 and had exposure to small caps and international stocks lagged the headline S&P 500 return.
On the fixed income side, shorter maturities outperformed intermediate and longer dated bonds of similar credit quality as the yield curve twisted. Rates at the short end of the curve moved down in line with Fed action, while rates at the intermediate and longer sections of the curve moved up as noted above. Higher starting yields helped fixed income across the curve. The benchmark Bloomberg U.S. Aggregate Bond index ended the year barely positive at 1.25%. With an ending yield around 4.5%, it’s clear that the principal value declined on higher rates and was more than offset by yield.
Looking Ahead to 2025
Investment and economic outlooks for the next year are littered with opinions that have embedded contradictions such as being cautiously optimistic or uncomfortably bullish. Outlooks generally highlight a supportive economic backdrop for stocks as growth in the U.S. slows but stays ahead of the rest of the world, fiscal stimulus via pro-growth policies of the incoming administration supports continued profitability, and lower short-term interest rates which allows the engine of the U.S. economy – U.S. consumers – to continue to spend. All of these factors combine into U.S. equity earnings growth broadening and staying ahead of international markets.
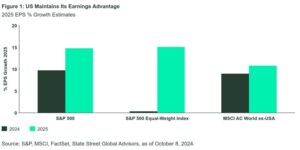
The chart below from State Street Global Advisors highlights this expectation.[8] Overall S&P 500 earnings for 2025 currently are projected to grow around 15% (column 1). Importantly, while earnings growth recently has been concentrated in technology and consumer discretionary stocks and skewed towards the largest companies, earnings growth is expected to broaden with the S&P 500 equal weight index also showing an expectation of nearly 15% growth. Every market sector currently is expected to provide positive growth in 2025 in a continuation of American exceptionalism.
As noted, however, commentaries are also hedged despite a strong fundamental outlook. The downside scenarios generally come from stretched valuations in U.S. equities, particularly in the top names of the S&P 500.
According to J.P. Morgan, at year-end, the top 10 stocks in the S&P 500 traded at a forward valuation of nearly 30x expected earnings. The remaining stocks traded at an average valuation of 18x expected earnings. The valuation discrepancy is consistent with an expected growth discrepancy. That is, the top 10 stocks are expected to exhibit stronger growth years into the future relative to the rest of the index.
If that growth continues, then perhaps the valuation difference will prove to be warranted. However, the high valuations also mean the top stocks, which now represent nearly 40% of the S&P 500 value, are susceptible to disappointment.
The downside cases arrive in the form of Rumsfeld’s known unknowns and unknown unknowns.
Some of the known unknows are:
- The future course of inflation. Does inflation continue to improve and drive towards the Fed’s 2% target, or does strong economic fundamentals resulting in strong growth and consumer spending mean inflation once again starts to move higher? If inflation moves up, then the early trend in bond markets to a higher yield may persist, and higher rates are generally bad for stocks (all else equal).
- Trump Administration Policies. Most strategists believe Trump will soften his campaign stance of across-the-board tariffs to a much shorter list of selective tariffs. If actual policy looks more like the campaign positions, then tariffs may be inflationary, resulting in a Fed which has to reverse position and possibly raise rates to defend. A sub-known unknown within this theme is an acknowledgement that Trump will have the opportunity to replace Powell at the Fed, and a Trump appointee is unlikely to aggressively raise rates. What happens if markets come to believe the Fed will no longer be willing to fight inflation?
- The impact of AI. Market participants have a history of overestimating the impact of new technologies in the short run, while underestimating the impact over the longer run. In the short run, that means lofty expectations for continued earnings growth and the possibility of disappointment resulting in equity pullbacks. Longer term, this trend likely is supportive to equities beyond the chipmakers.
- Trump himself is a known unknown as we move back into policy communications via Twitter (ok, X, but really, it’s still Twitter). Trump’s propensity for shock and awe via social media could mean more volatility ahead as markets try to react day-to-day to the implications of those statements.
Some of the unknown unknowns are, well, … unknown. We’ll know it when we see it, but not before.
While international economies are expected to grow more slowly than the U.S., and international stock earnings growth is expected to be lower than the U.S., the advantage international stocks have is lower valuations and more room for upside surprise. International stocks trade at roughly a 40% discount to U.S. large caps. International stocks have continued to frustrate asset allocators as U.S. stocks have far outpaced international returns despite more than a decade of projections for the gap to narrow.
In the U.S., small caps have lagged larger companies for most of the last decade with only the occasional year of outperformance. Like international stocks, this has left small caps at a lower valuation relative to large companies. The S&P Smallcap 600 is trading at a forward valuation of 16x earnings, vs. 22 for the S&P 500. Notably, small companies are expected to produce earnings growth exceeding that of large companies in 2025. If that growth materialized, the lower price entry point may be rewarded.
Fixed income markets look more attractive as a portfolio component with yields in the 4-5% range on investment grade credit. 2024 illustrated the value of yield as a hedge against price movement. The outlook for credit also appears reasonable as most companies, like homeowners, refinanced debt when rates were low and don’t face significant refinancing for many years into the future. This is expected to limit defaults and likely is a contributing factor to very low credit spreads relative to treasuries.
Taken together, the various outlooks do result in a cautiously optimistic view with an expectation that the path forward may be more volatile than recent history.
If you have any questions regarding the content above, please reach out to your advisor.
Disclosure:
The views expressed represent the opinion of Riverchase Wealth Management, LLC. The views are subject to change and are not intended as a forecast or guarantee of future results. This material is for informational purposes only. It does not constitute investment advice and is not intended as an endorsement of any specific investment. Stated information is derived from proprietary and nonproprietary sources that have not been independently verified for accuracy or completeness. While Riverchase Wealth Management, LLC believes the information to be accurate and reliable, we do not claim or have responsibility for its completeness, accuracy, or reliability.
Statements of future expectations, estimates, projections, and other forward-looking statements are based on available information and Riverchase Wealth Management, LLC’s view as of the time of these statements. Accordingly, such statements are inherently speculative as they are based on assumptions that may involve known and unknown risks and uncertainties. Actual results, performance or events may differ materially from those expressed or implied in such statements. Investing in equity securities involves risks, including the potential loss of principal. While equities may offer the potential for greater long-term growth than most debt securities, they generally have higher volatility. International investments may involve risk of capital loss from unfavorable fluctuation in currency values, from differences in generally accepted accounting principles, or from economic or political instability in other nations. Past performance is not indicative of future results.
Advisory services provided by Riverchase Wealth Management, LLC, a registered investment advisor.
[1] GDP Data from Bureau of Economic Analysis
[2] Labor data from Federal Reserve Bank of St. Louis
[3] CPI Data from Bureau of Labor Statistics, PCE data from Bureau of Economic Analysis
[4] Rate data from Federal Reserve Bank of St. Louis
[5] S&P Global, S&P 500 Total Return as of 12/31/2024
[6] Section data from https://www.schwab.com/learn/story/it-was-very-good-year
[7] MSCI data
[8] State Street Global Advisors, “Global Market Outlook 2025,” December 4, 2024