
We are less than a month from the highly anticipated Election Day 2024. The race for President is very tight and is expected to be decided in just a few swing states. Not only is the race at the top close, the down-ticket races which will determine control of the House of Representative and Senate are similarly close. If any of the battleground states are particularly close, it may be months before an outcome is known.
Emotions are running high and political pundits are adding to the angst with doom and gloom prognostications from both sides if their side should lose. Surely, a win by one of the parties must be good for the market while a win by the other party must be bad for markets! As you read this, you likely have your own view of which party is which in the prior sentence depending on your own political leanings. Cue the calls to move to Canada!!
Every four years, we get questions about the impact on portfolios and investment strategy in the context of national elections. We will skip to the conclusion before circling back with some evidence: Markets generally have been more concerned with underlying economic and thematic trends than which party is in power. There is, at best, weak evidence of a short-term relationship between elections and the winning combination of control, and generally no evidence of a long-term relationship.
The chart below plots monthly returns of the S&P 500 from January 1926 through December 2023. Each month’s return is added to the column for that return. For example, if a month had a return of 1.5%, a dash is added to the column representing 1-2% (which happens to be the most common monthly return).
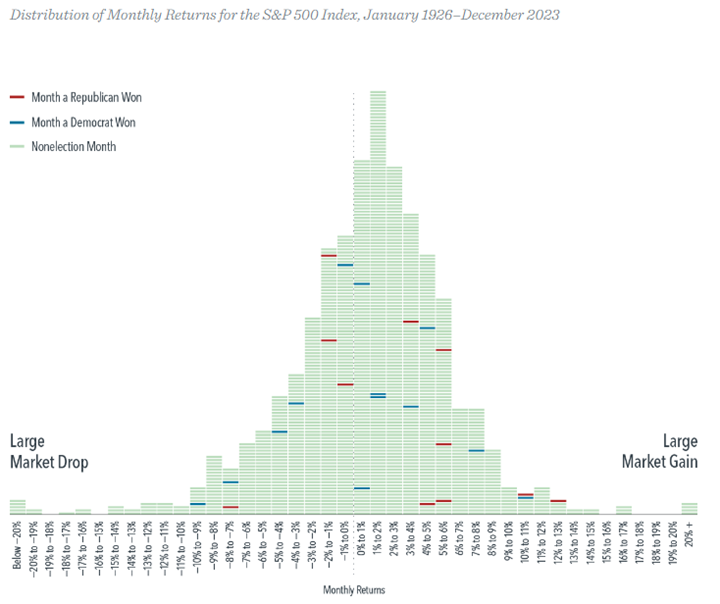
The green months represent non-election months, while the colored dashes represent election months – blue means a Democrat won, while red means a Republican won.
If a particular party winning was better for markets than the other, we would expect to see the red/Republicans won months stack on one side of the distribution, while the blue/Democrats won months would stack on the other side of the distribution. Furthermore, if markets reacted strongly to elections, we would expect to see election months clustered farther to the left or right of the center as an election would necessarily have a large positive or negative return. However, what the graph shows is there is no discernible lopsidedness of outcomes based on which party wins or for election months generally.[i]
Perhaps the focus of the above chart is too limiting. After all, the President cannot govern without consideration being given to Congress. We should therefore consider whether power is aligned with a single party controlling the White House and Congress. If it mattered, we would expect to see a statistically significant deviation of performance relative to non-election periods.
The chart below shows market data from 1948. Analysts reviewed three-month rolling returns and compared the three-month period following an election to the average non-election three-month returns.
Surprisingly, returns from election periods following a single party sweeping power were NOT statistically different from the non-election periods. However, there have been three combinations of power which have resulted in statistically different returns. When a Democrat has won the White House, while Congress was either controlled by Republicans or Congressional power was split, performance has been positively skewed and statistically significant. When a Republican has won the White House while Democrats controlled Congress, performance has been negatively skewed and statistically significant. All other combinations have resulted in performance which is not statistically different from non-election periods.

The above is strictly historical data and is not intended to suggest a particular combination would be better in the future. It is actually highly likely that the results have absolutely nothing to do with the mix of party control and election results. It is more likely that the attribution to political control is a spurious correlation to something more important driving stock returns. Importantly, over the medium and long-term, even the weak statistical relationship disappears as factors like wars, pandemics, technological innovation, interest rate policy, consumer trends, etc., have proven to be more important to stock earnings than who is in power. In addition, with a limited data set of power transfers, there may be some component of coincidental timing around a change in control which isn’t the result of policy cause and market effect.
For example, during the dual terms of President Clinton, the S&P 500 grew an aggregate of 210%, the highest aggregate return of any presidency since World War II.[ii] The effectiveness of Clinton’s policies can be argued, but it cannot be argued that he benefited from the dawn of the internet age and the inclusion of a building tech stock bubble in his track record. At the time of his hand-off of power to President Bush, the bursting of the internet bubble had only started. The S&P 500 was barely off 11% at Bush’s inauguration.[iii] The crash which Bush inherited would continue into the second year of his term, with the S&P 500 shedding more than an additional 40%.[iv] Is that the result of the Bush administration’s policies, or unfortunate timing of the change in power in the middle of a bubble? Had Vice President Gore won the 2000 election, would the stock market crash have been any different?
Bush was also the recipient of a double whammy as his presidency was book-ended by the Great Recession. Again, policy can be argued and would have to include a discussion of the culpability of the Federal Reserve (non-elected and independent) and interest rate policy as a contributing factor to the housing bubble and resulting market crash. The point here isn’t policy, it’s inadvertent timing. The biggest beneficiary of this timing? – President Obama, who essentially inherited a stock market near the trough of the recession. This timing, along with very accommodative Federal Reserve policy through the period, hands the Obama presidency the second highest aggregate return on the S&P 500 at 182%.2 Had Senator McCain won the 2008 election, is it not likely that he would have had the same tailwind of a market recovery?
The point of the above is to show that the main driver of market returns around the change in power from Bush to Clinton to Bush (II) to Obama had very little to do with the outcome of each election and much more to do with economic and market themes which happened to be present at the time of each election.
And so, we come to Harris v. Trump and ask what the prevailing conditions are which either is likely to inherit? We are three-ish weeks from the election, and equity markets are trading near all-time high levels. That is great for the Biden administration but creates a difficult starting valuation for either incoming President. Historical data suggests forward returns are inversely correlated with starting valuations such that a high starting value (like we have today) has historically resulted in muted forward returns. At the same time, just as the Clinton presidency benefited from the dawn of the internet age, the 2025 presidency is likely to benefit from further growth in the AI economy regardless of policy. Either President could inherit a broadening war in the Middle East, China asserting dominance over Taiwan and neighbors in the South China Sea, growing desperation and unpredictability of Russia, weather events, and many other potential factors which have nothing to do with policy.
Final Thought: At the margin, the balance of power can obviously impact things that do matter to companies – regulatory regime and tax policy come to mind. But it is important to limit the attribution of elections/policy to market performance as underlying consumer trends and themes can have a much greater impact on markets. Companies will adjust to policy changes and figure out how to continue to make money. They just need to know what the new set of rules are. We generally do not advocate for significant changes to client portfolios based on election outcomes.
Sources:
[i] Dimensional Fund Advisors LP
[ii] Forbes, “Historical Stock Market Returns Under Every US President,” June 30, 2021
[iii] S&P 500 historical data from Yahoo Finance
[iv] Ibid
Disclosure:
The views expressed represent the opinion of Riverchase Wealth Management, LLC. The views are subject to change and are not intended as a forecast or guarantee of future results. This material is for informational purposes only. It does not constitute investment advice and is not intended as an endorsement of any specific investment. Stated information is derived from proprietary and non-proprietary sources that have not been independently verified for accuracy or completeness. While Riverchase Wealth Management, LLC believes the information to be accurate and reliable, we do not claim or have responsibility for its completeness, accuracy, or reliability.
Statements of future expectations, estimates, projections, and other forward-looking statements are based on available information and Riverchase Wealth Management, LLC’s view as of the time of these statements. Accordingly, such statements are inherently speculative as they are based on assumptions that may involve known and unknown risks and uncertainties. Actual results, performance or events may differ materially from those expressed or implied in such statements. Investing in equity securities involves risks, including the potential loss of principal. While equities may offer the potential for greater long-term growth than most debt securities, they generally have higher volatility. International investments may involve risk of capital loss from unfavorable fluctuation in currency values, from differences in generally accepted accounting principles, or from economic or political instability in other nations. Past performance is not indicative of future results.
Advisory services provided by Riverchase Wealth Management, LLC, a registered investment advisor.
Sources:
[i] Dimensional Fund Advisors LP
[ii] Forbes, “Historical Stock Market Returns Under Every US President,” June 30, 2021
[iii] S&P 500 historical data from Yahoo Finance
[iv] Ibid